
WebAccess Express has a pre-built monitoring graphical Device Monitor and Management Interface. Users can save the time of the drawing and configure the information page and use the default pages to monitor and manage the device directly. The WebAccess Express View pages show the Device Overview and Device Status and set the Device Detail information, E-mail, and Alarm Value for building the Device Monitor and Management System.
Device Overview:The main page of the device monitor interface. WebAccess Express now supports ADAM 2000/4000/6000 series, DiagAnywhere driver, SNMP driver, and EKI series. The overview page provides the entire information for six types of device.
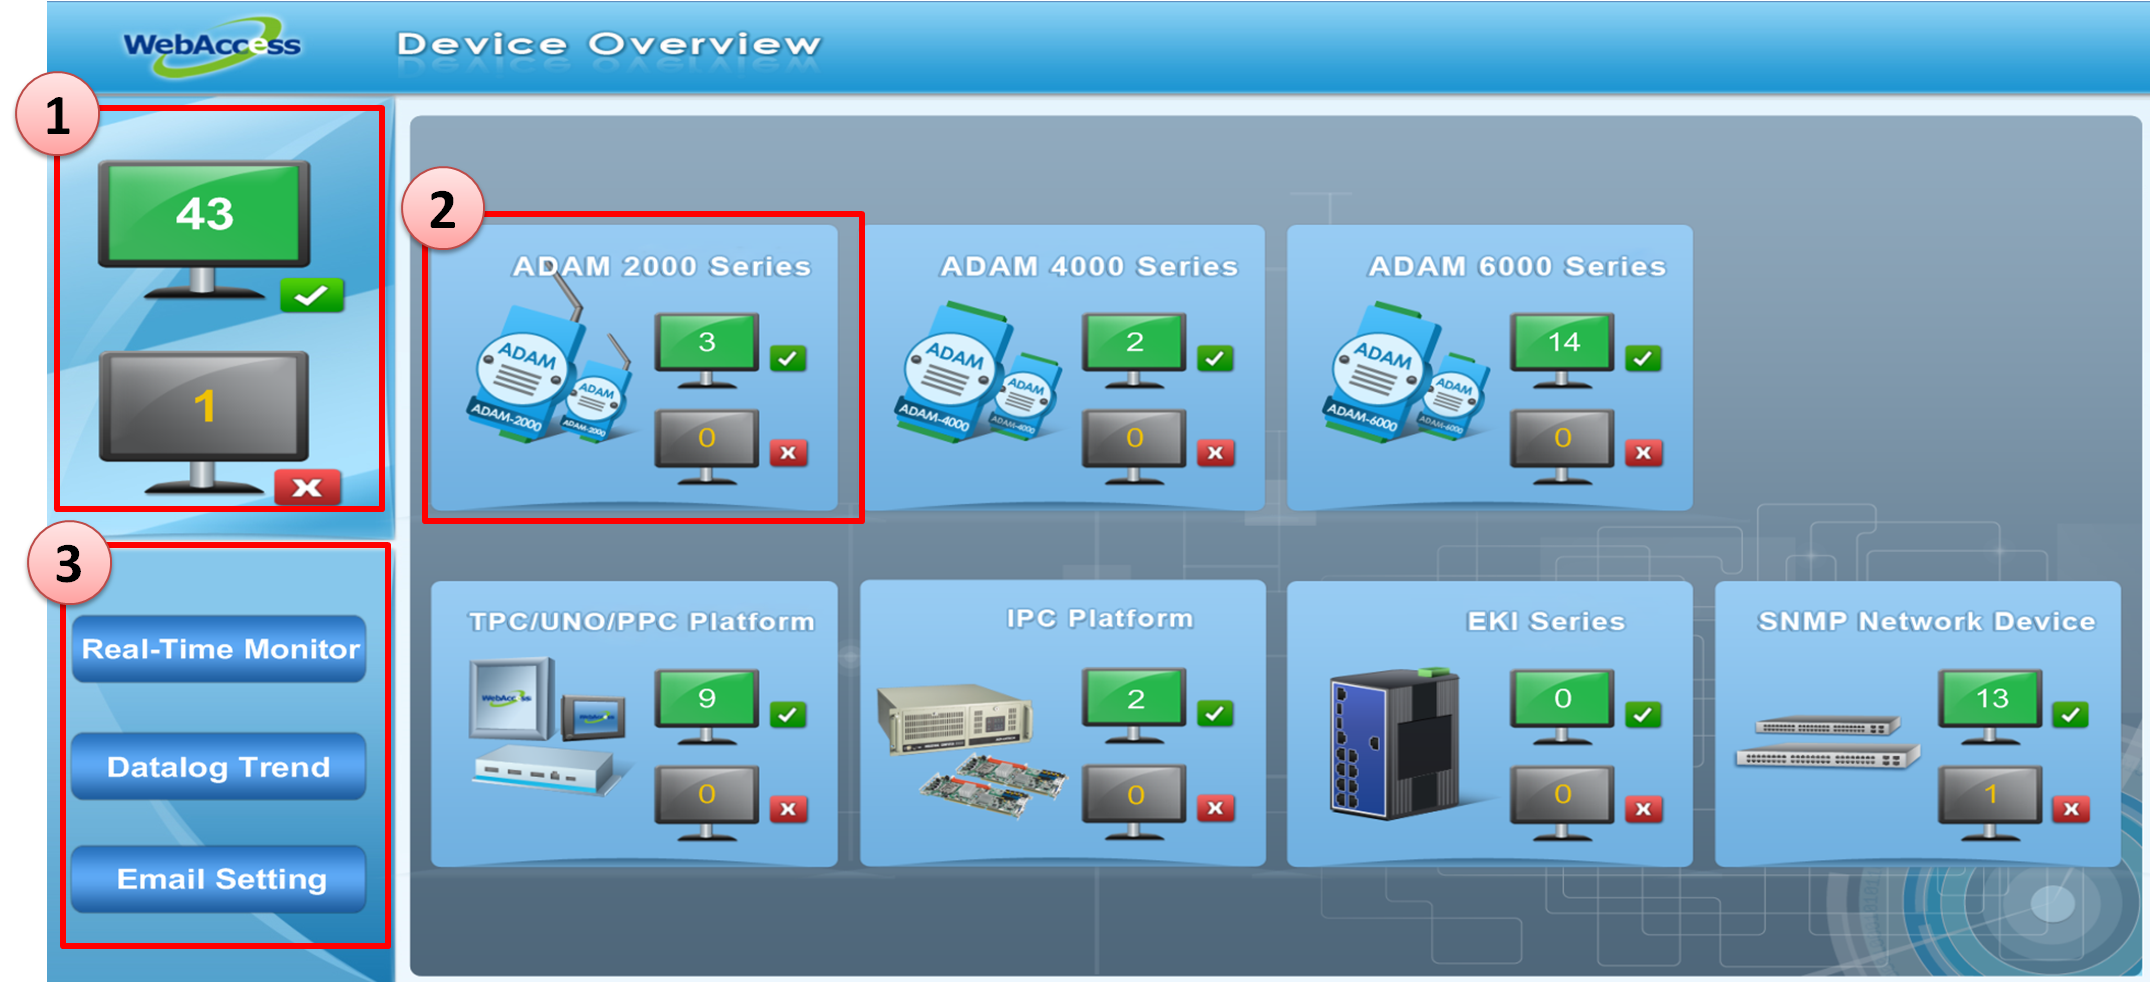
Figure 24.4.3.1: WebAccess Express Display Page – Device Overview
1. Overview Status:The total amount of connected and disconnected devices in the WebAccess Express Project
2. Devices Status:The total amount of devices based on each type of connected and disconnected devices. Users can click the number in the icon to monitor the information of the connected devices.
3. Function bar of the project:Users can change the page with the function button to display the device detail data, datalog trend, and Email setting page.
Real-Time Monitoring:Display the real-time data of each of the online devices
Group Tab:According to the overview information in Express project, it can be divided into six types of tab. Each tab will show the status of six devices .
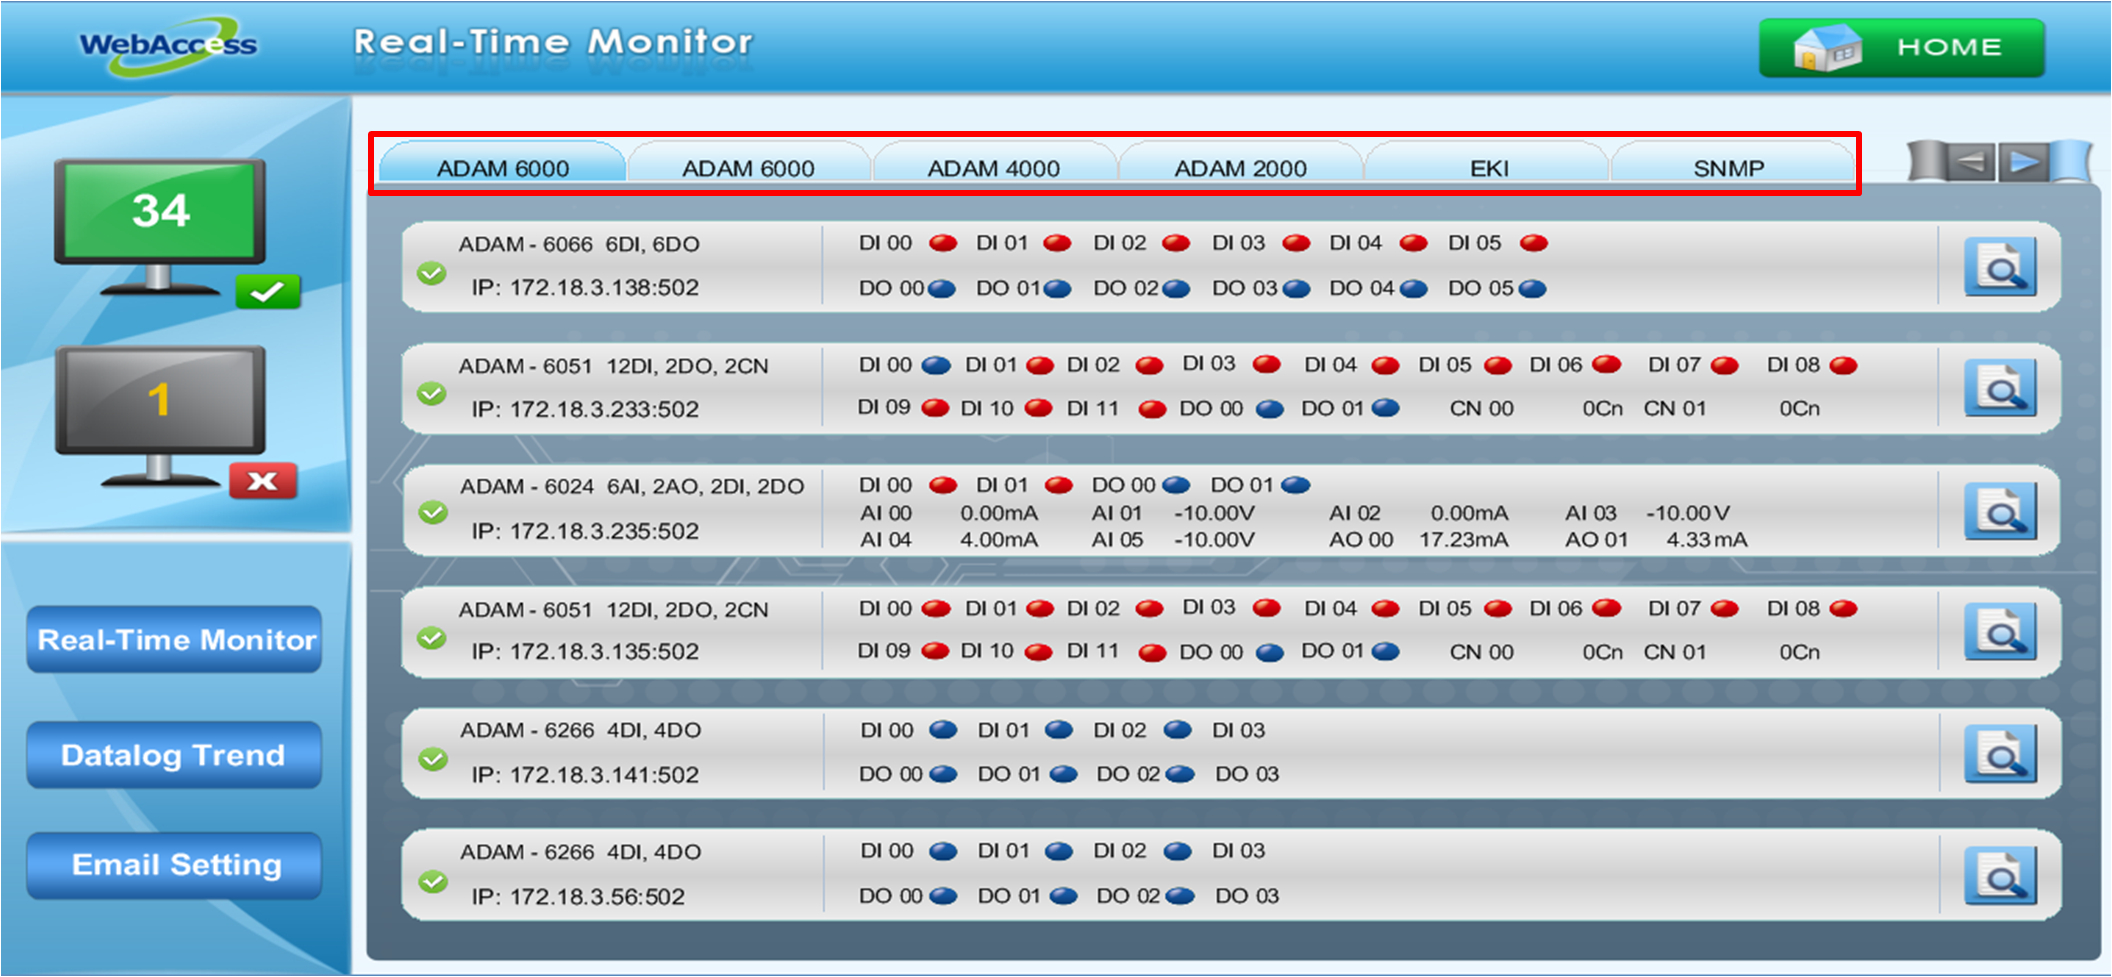
Figure 24.4.3.2: WebAccess Express Display Page – Real-Time Monitor
ADAM Device display page:Monitor the ADAM module data of the ADAM2000/4000/6000 series the project support.
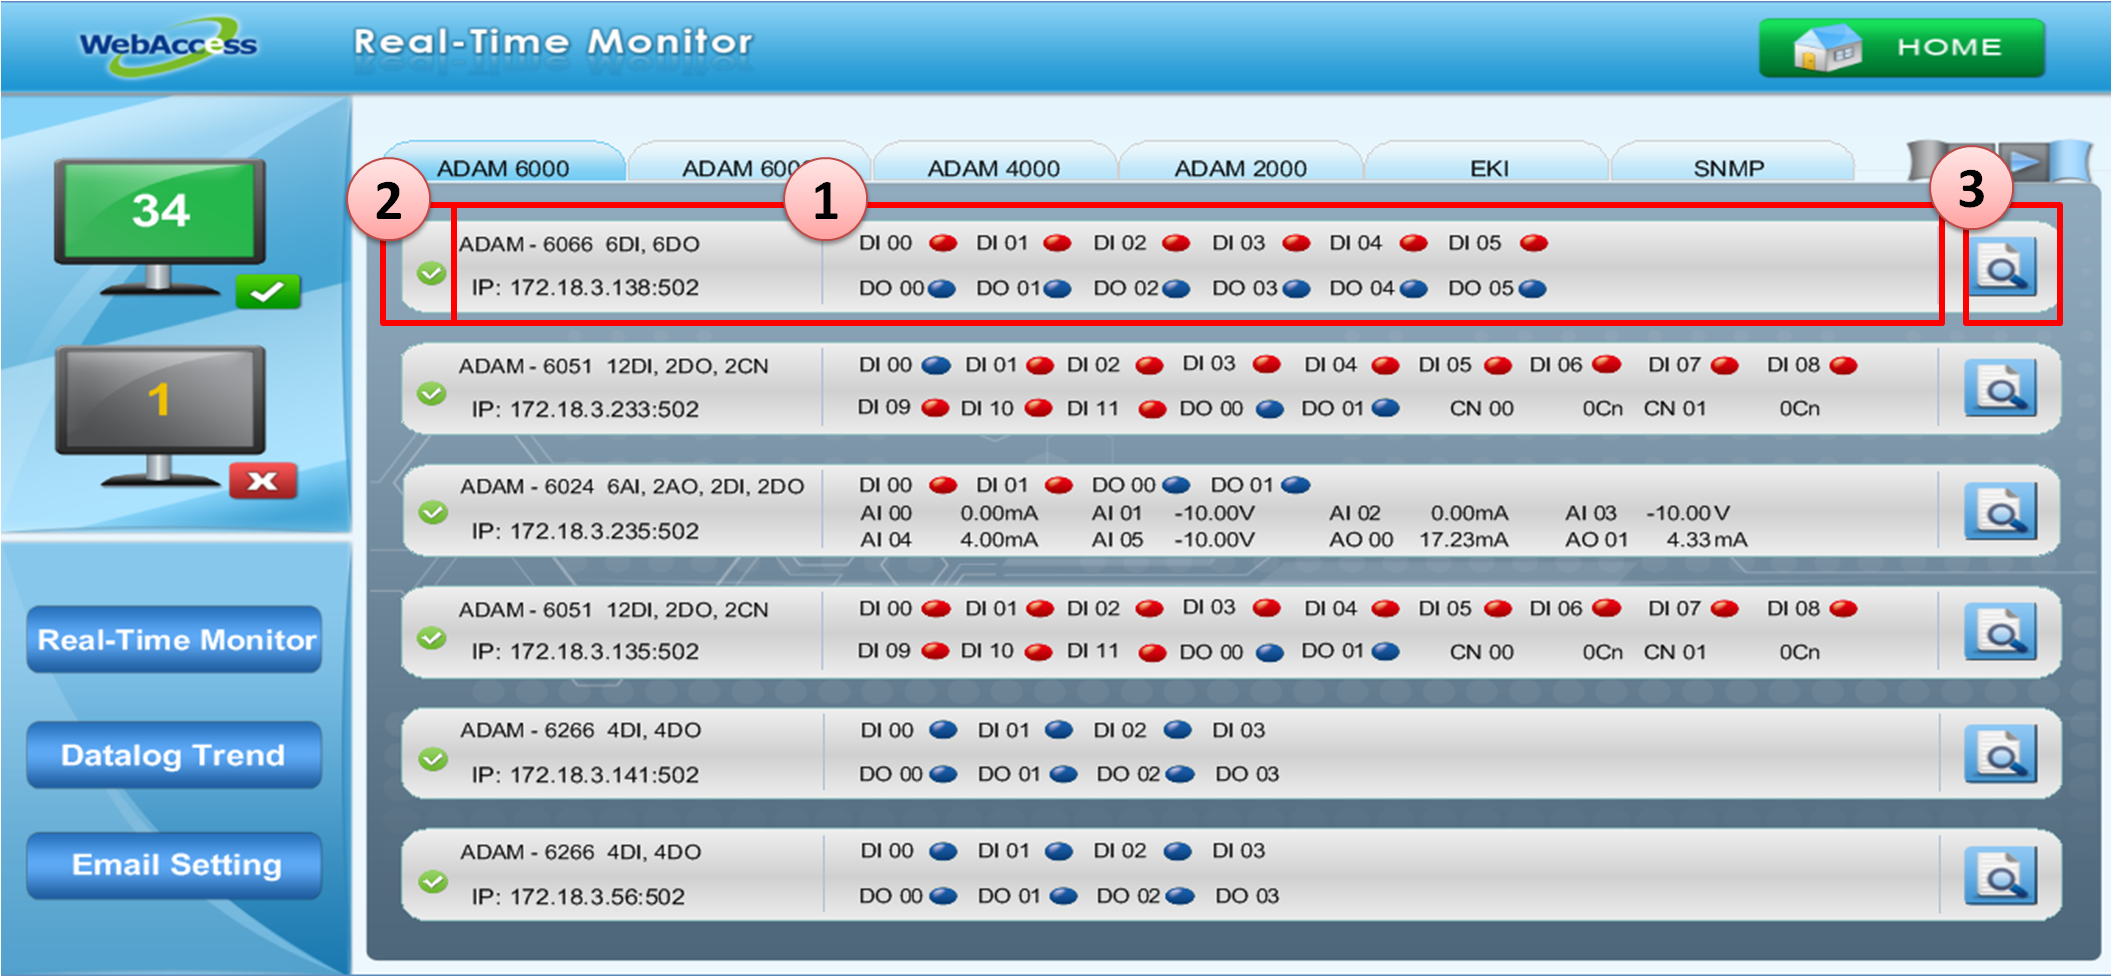
Figure 24.4.3.3: WebAccess Express Display Page – ADAM Device
1. Face Plate:Show the information of I/O Modules, including Device name, IP and I/O status.
DI/DO status will show in 0 Status and
  in 1 Status.
AI/AO status will show the real-time value. When the value achieves the setting Alarm value, the value of tag will change red and flicker to remind the monitor.
2. Device Status:The icon shows the device situation. is online /
  is offline /
  is an Alarm . The icon will change to Alarm as more than one tag has an alarm.
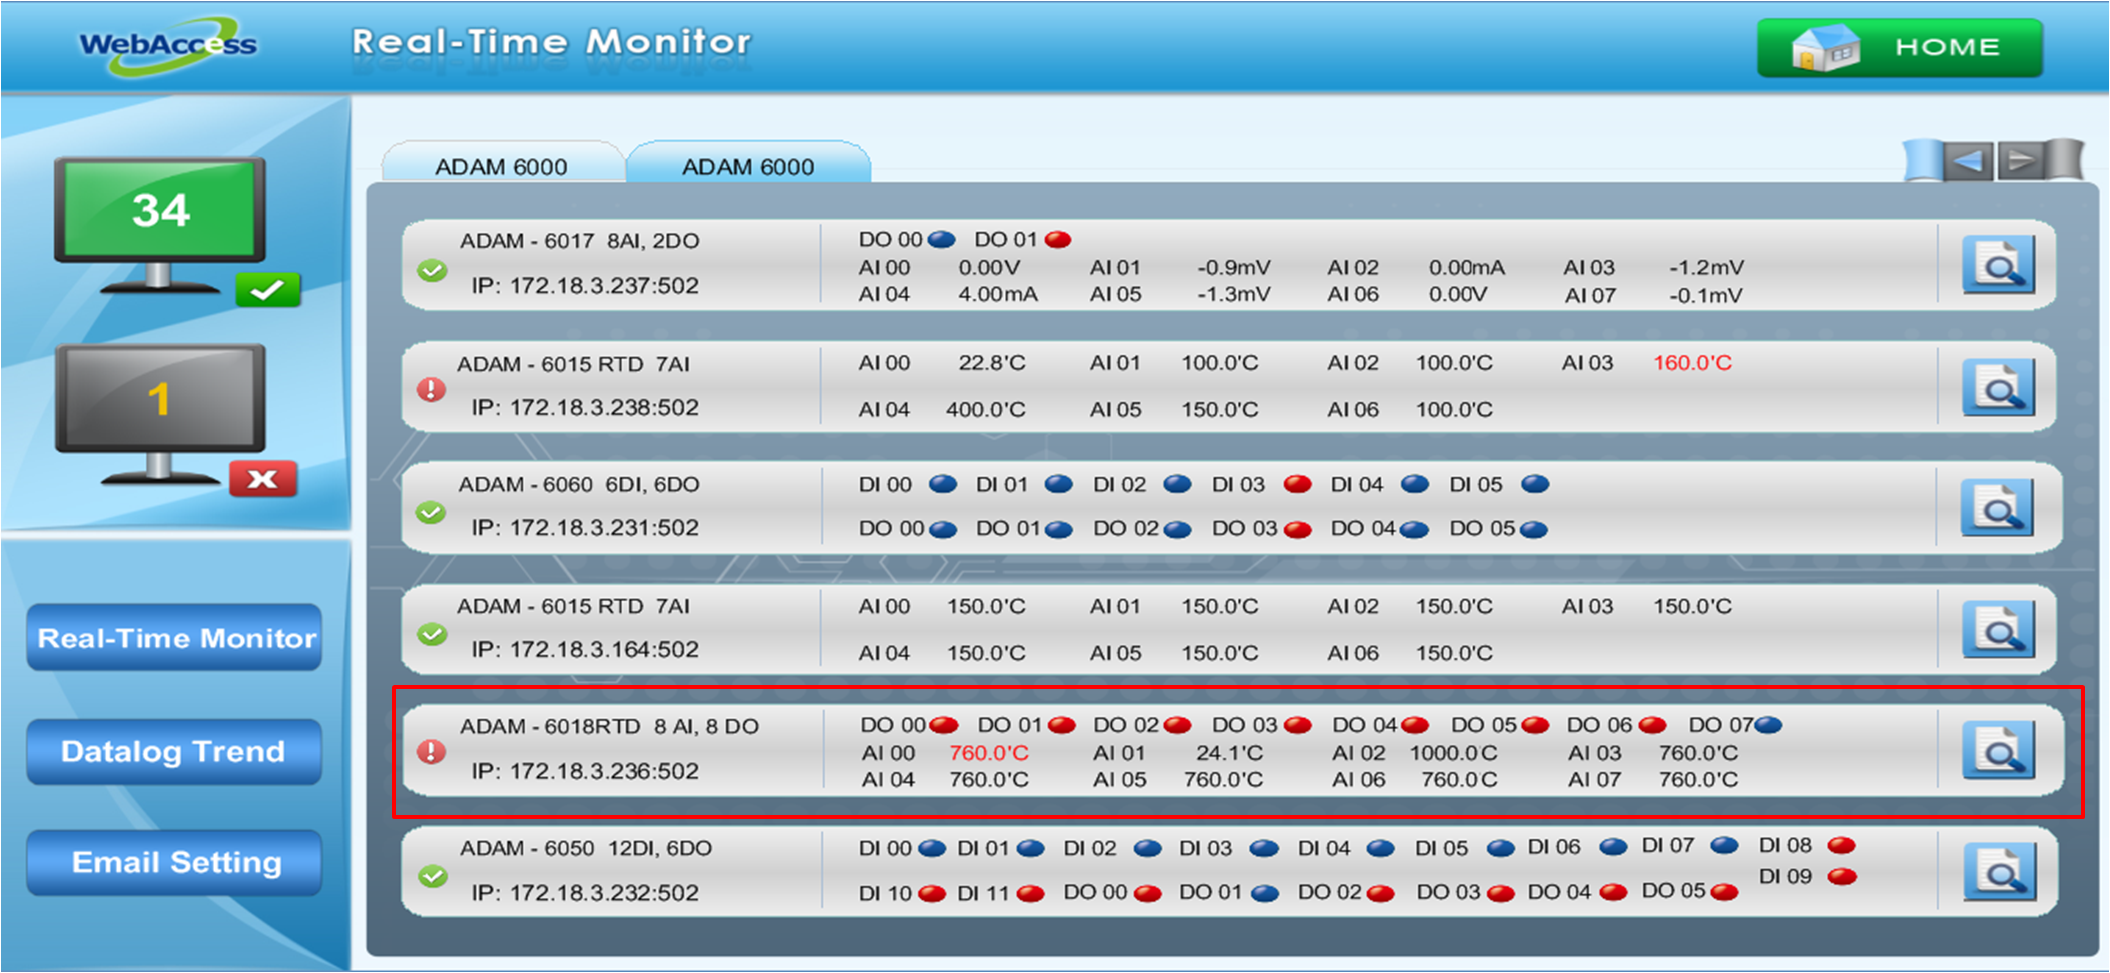
Figure 24.4.3.4: WebAccess Express Display Page –Device Alarm Status
3.  Device Information Setting button:Push the button to maintain the device information.
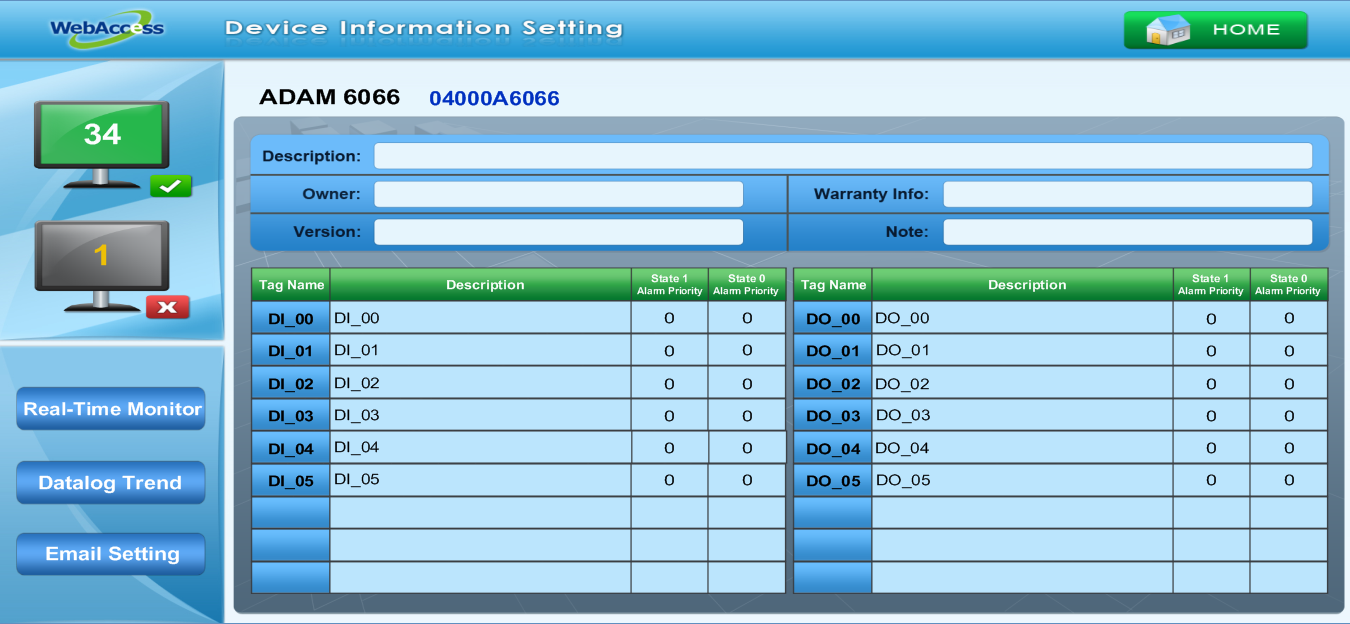
Figure 24.4.3.5: WebAccess Express Display Page –ADAM Device Information
Device Information Setting:Users can maintain the Device information and change the default settings via this page directly as the device maintenance management system. After changing, WebAccess will automatically save the information in the database.
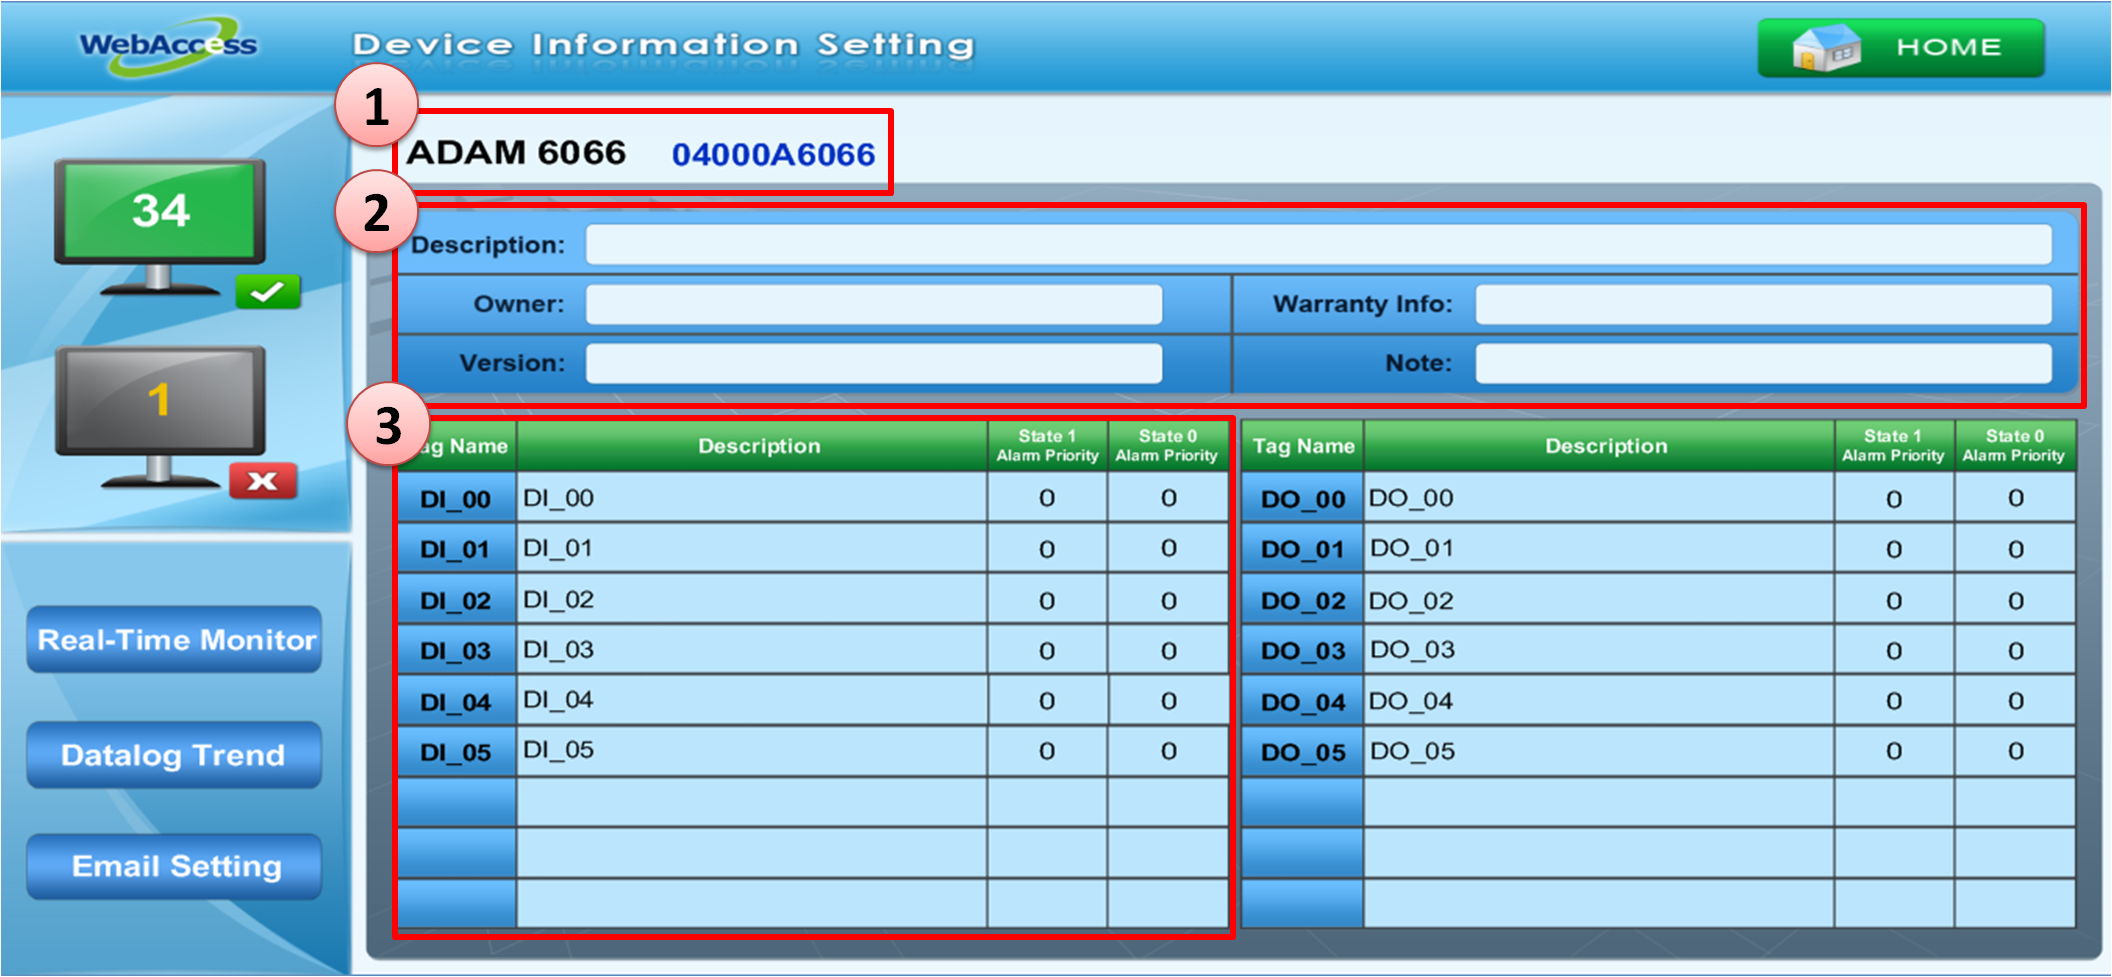
Figure 24.4.3.6: WebAccess Express Display Page – Device Information Setting
1. Device Name & Block Name:Shows the device name and the block name in WebAccess.
2. Device Detail Information:Users can type the device information, i.e. Description, Device Owner, Device Warranty Info, and Device version to maintain the device.
3. Tag Information:Change the Tag information, including Tag Name, Tag Description, and Alarm Priority of Tag status. The default page will show the default Tag and Description information built in the WebAccess block .The default High/Low Alarm setting value is the value which adds a 1% High/Low span.
TPC/UNO/PPC Platform health check page:Diagnose the Platform situation via the DiagAnywhere driver to check the health of the CPU, memory, temperature, and voltage of the target machine via this display.
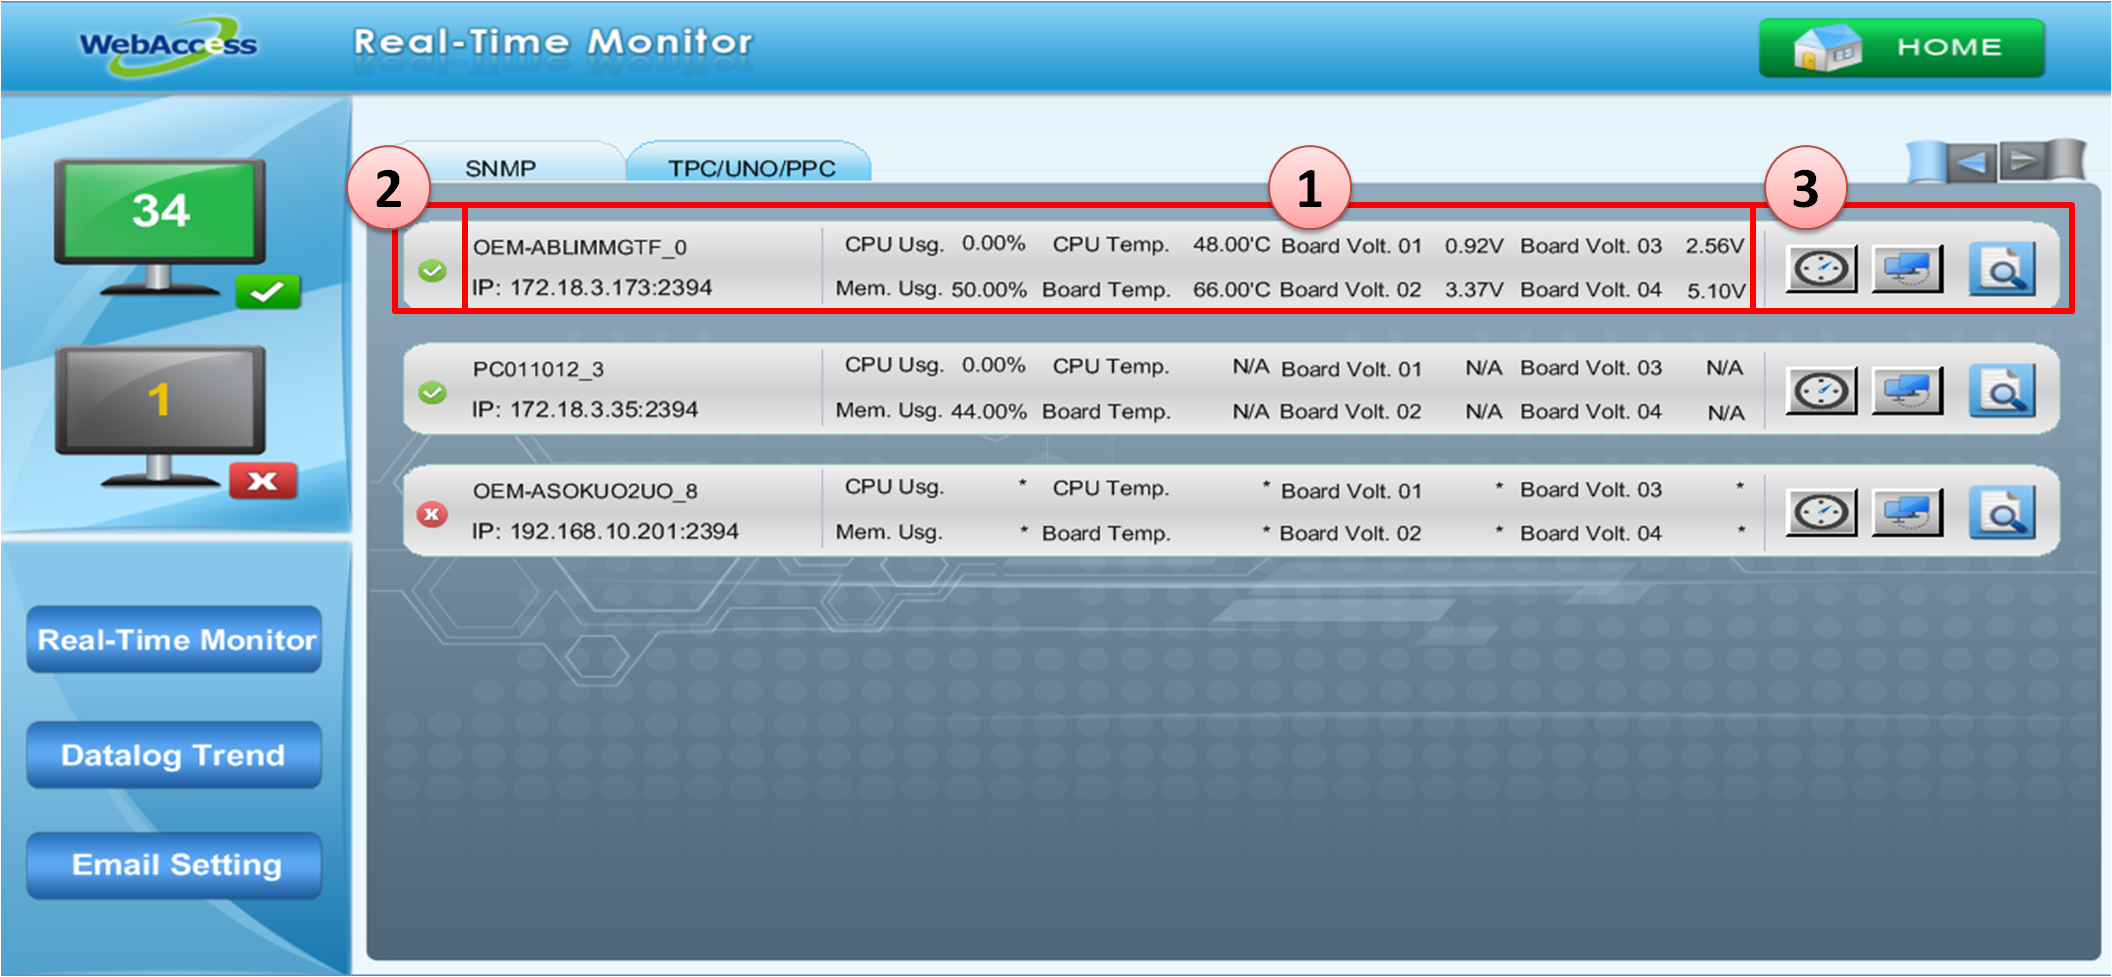
Figure 24.4.3.7: WebAccess Express Display Page – Platform Diagnose
1. Face plate:Shows the information of any Platform which has DiagAnywhere Driver installed. It includes the device name, IP and platform status.
2. Platform Status:The icon shows the device situation. is online / is offline / is Alarm. The icon will change to Alarm status when more than one tag is issuing an alarm .
3. Function buttons:
 Time Synchronization:Users can synchronize the time of the remote device to the local host.
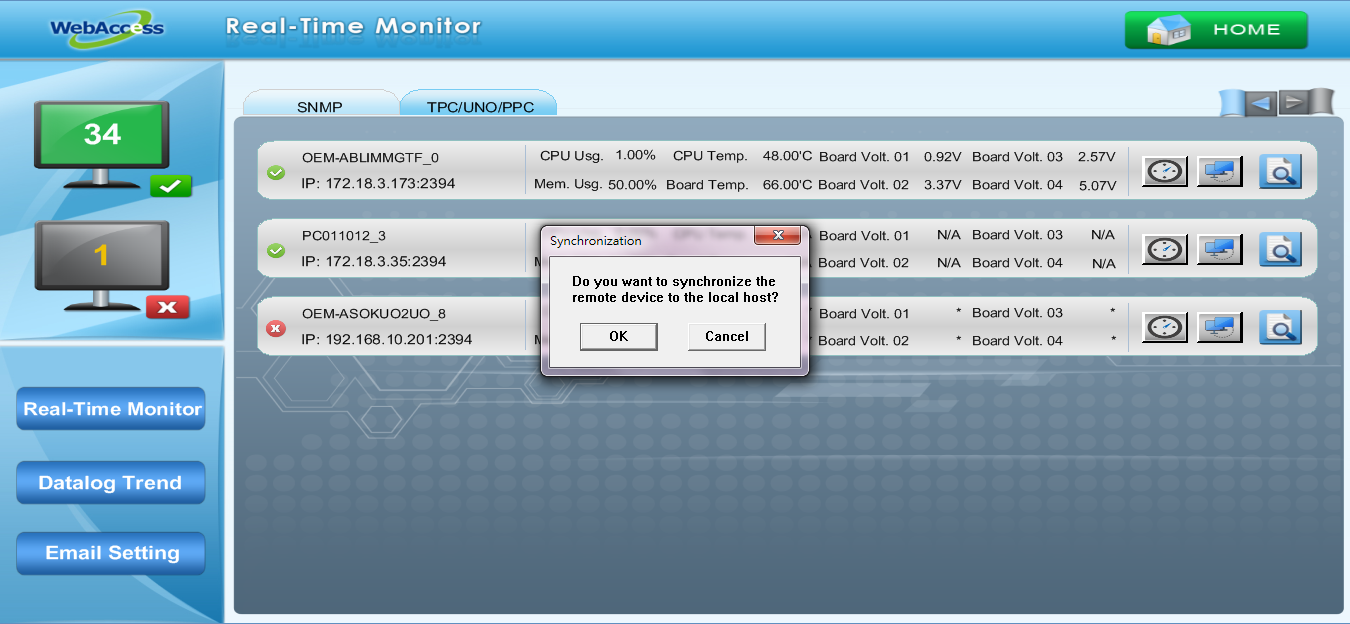
Figure 24.4.3.8: WebAccess Express Display Page –Time Synchronization
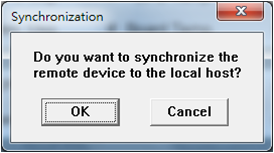
Figure 24.4.3.9: WebAccess Express Display Page –Time Synchronization window
 Remote Desktop:Users can connect the remote platform to operate the desktop, check the platform, and maximize/minimize Window on DiagAnywhere Diagnosis page. There are two options under this function that will only work when a connection has been built by the server.
Screen Snapshot
File Transfer
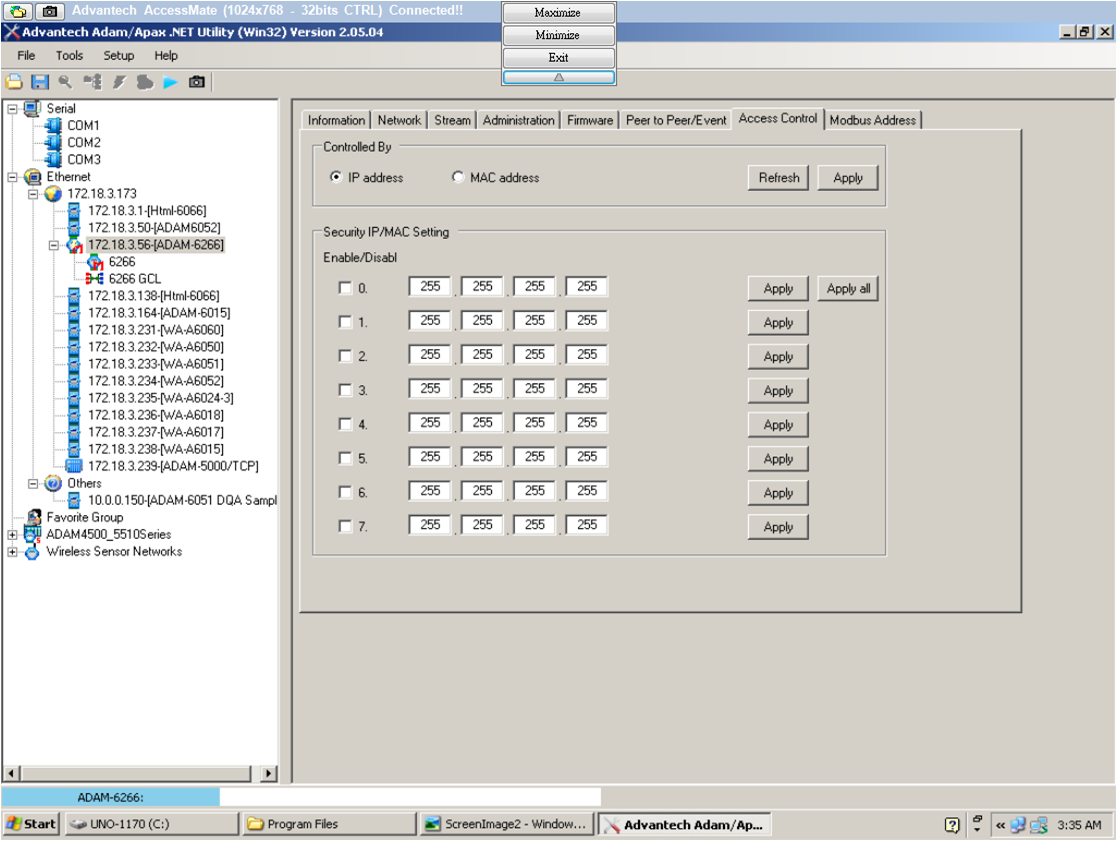
Figure 24.4.3.10: DiagAnywhere Diagnosis page
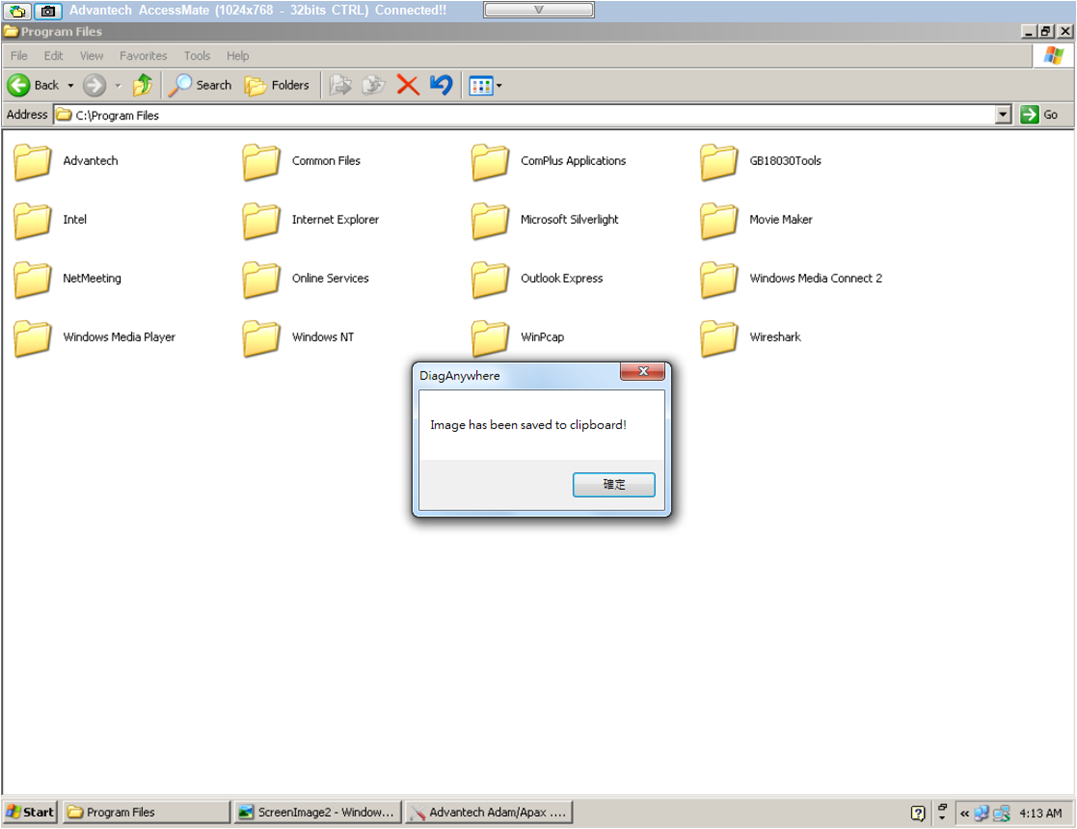
Figure 24.4.3.11: Screen Snapshot Option
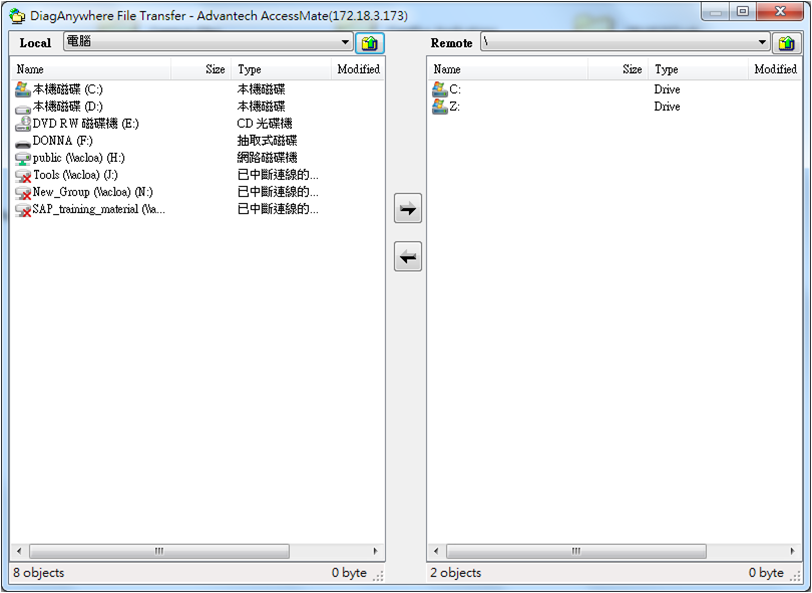
Figure 24.4.3.12: File Transfer Option
Device Information Setting button:Push the button and go to maintain the device detail information.
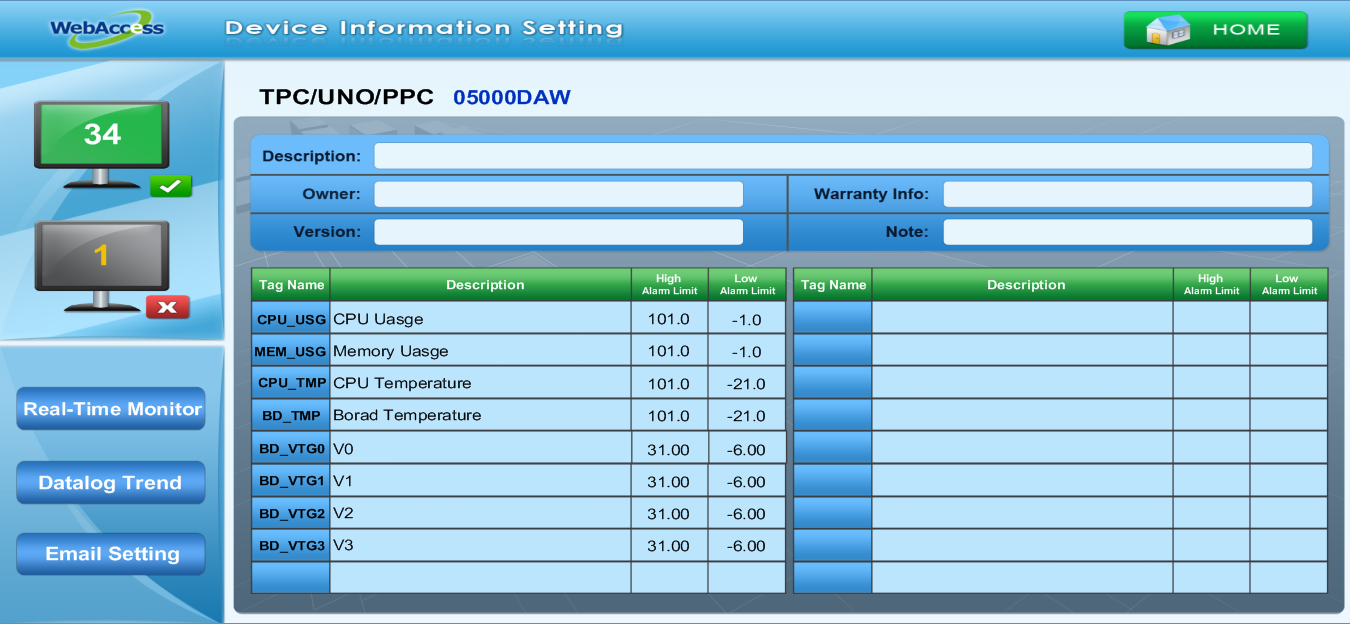
Figure 24.4.3.13: TPC/PPC/UNO Device Information Setting
IPC Platform health check page:Diagnose the Platform situation via the DiagAnywhere driver to check the health of the CPU, memory, temperature, and voltage of the target machine via this display.
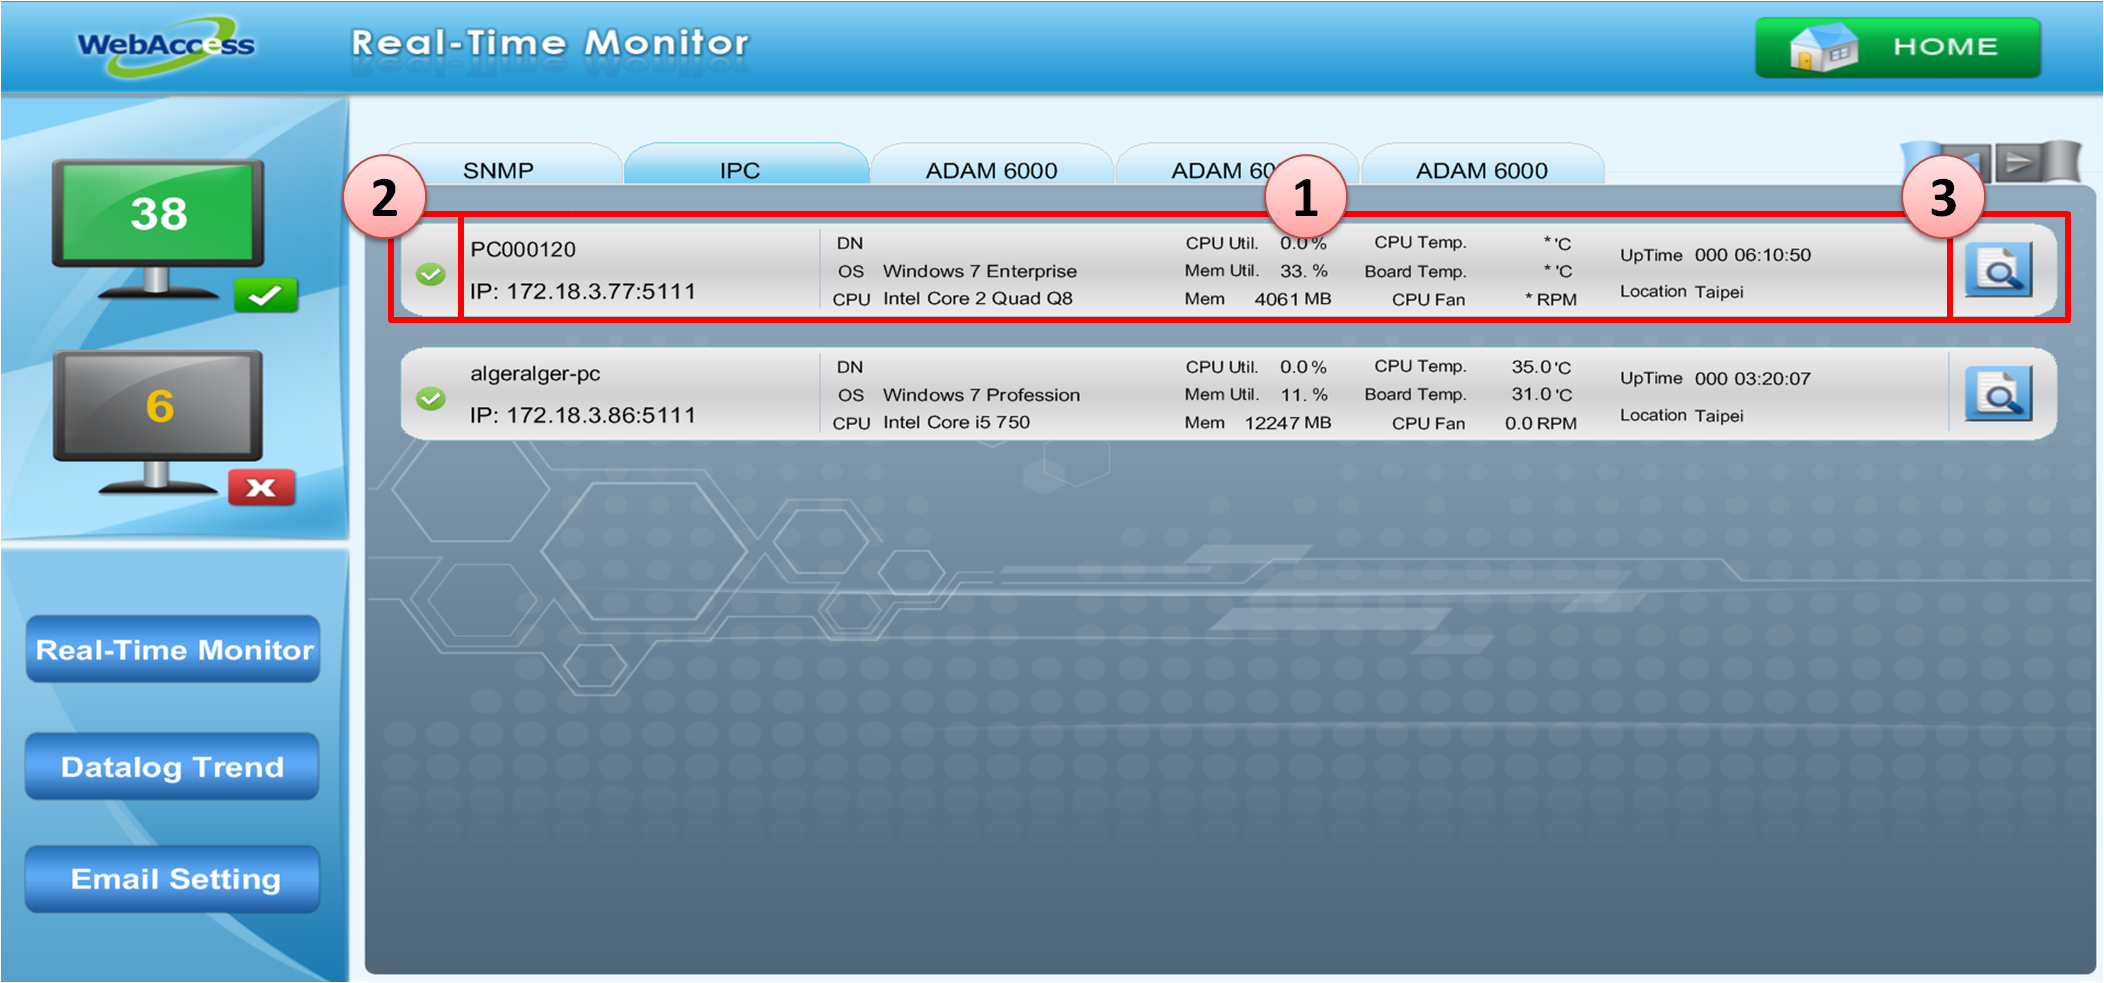
Figure 24.4.3.11: WebAccess Express Display Page – Platform Diagnose
1. Face plate:Shows the information of any Platform which has DiagAnywhere Driver installed. It includes the device name, IP and platform status.
2. Platform Status:The icon shows the device situation. is online / is offline / is Alarm. The icon will change to Alarm status when more than one tag is issuing an alarm .
3. Function buttons: ![]() Device Information Setting button:Push the button and go to maintain the device detail information.IPC Platform health check page:Diagnose the Platform situation via the DiagAnywhere driver to check the health of the CPU, memory, temperature, and voltage of the target machine via this display.
Device Information Setting button:Push the button and go to maintain the device detail information.IPC Platform health check page:Diagnose the Platform situation via the DiagAnywhere driver to check the health of the CPU, memory, temperature, and voltage of the target machine via this display.
EKI Device display page:Monitor the Advantech EKI devices situation via SNMP driver. The project support EKI Switch/Wireless/Device series.
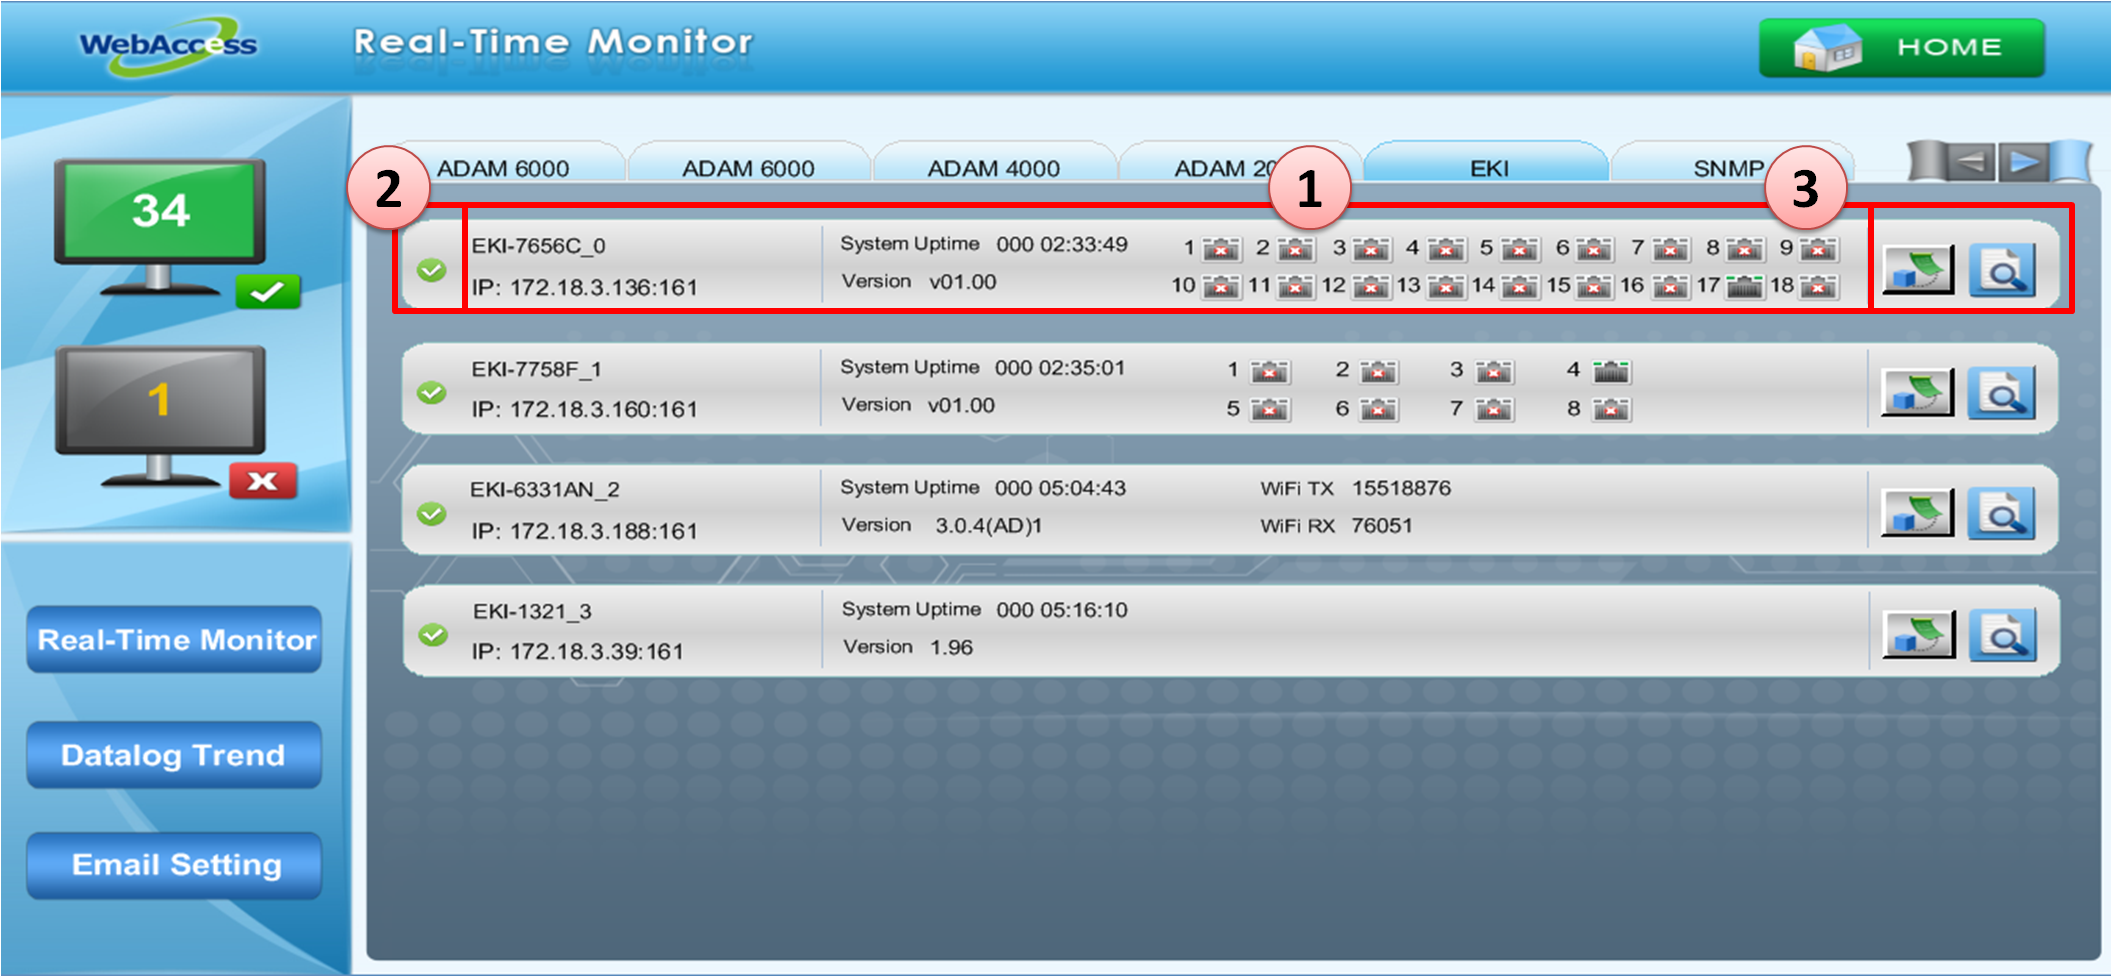
Figure 24.4.3.14: WebAccess Express Display Page –EKI Device
1. Face plate:Show the information of EKI Modules, including Device name, IP, System Uptime, Firmware Version, and Port/Wireless Status.
EKI Switch Device:Ethernet Port status will show when connected and
  when disconnected.
EKI Wireless Device:Wireless status will show the network flow status, including Wireless total output ( Wi-Fi TX ) and Wireless total intput ( Wi-Fi RX ).(Unit:Bytes)
2. Device Status:The icon shows the device situation. is online / is offline / is Alarm status. The icon will change to Alarm status when more than one tag is in alarm value.
3. Function buttons:
 EKI Setting Page Connection:Push the button and go to EKI setting page. Users can change the system information setting directly.
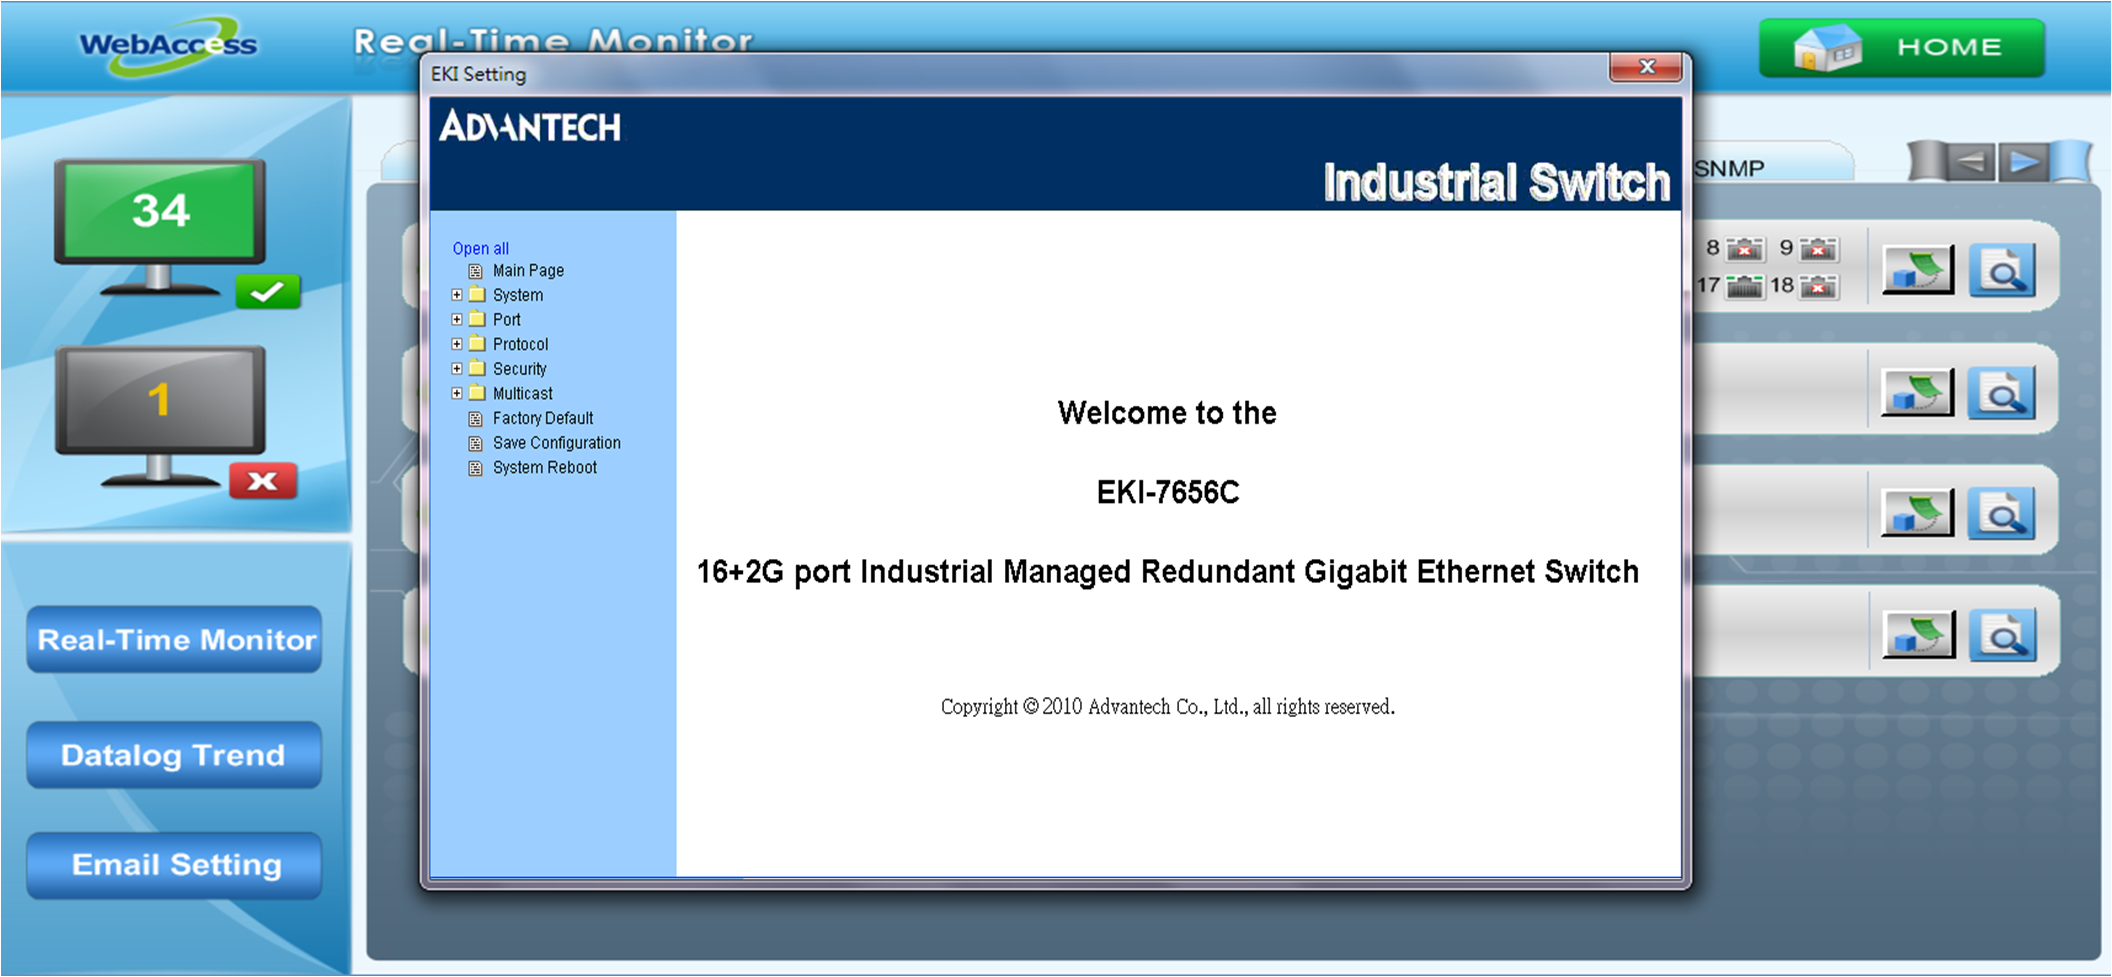
Figure 24.4.3.15: EKI Setting Page Connection
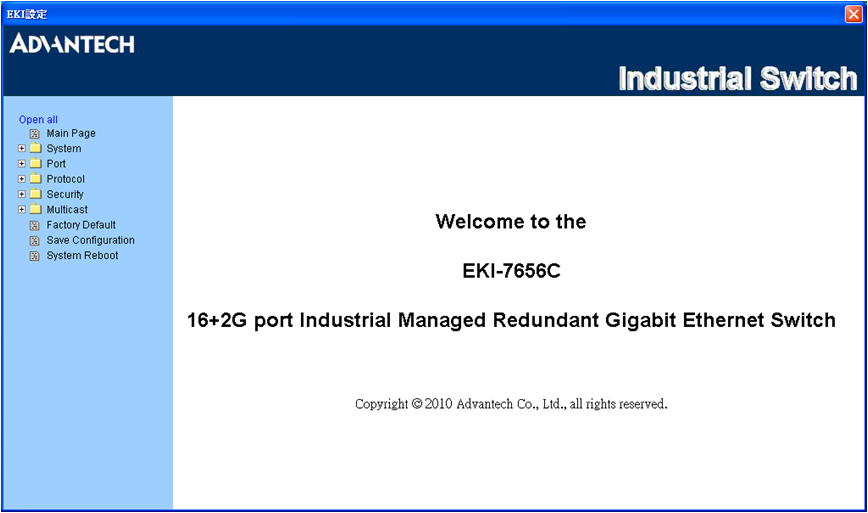
Figure 24.4.3.16: EKI Setting Main Page
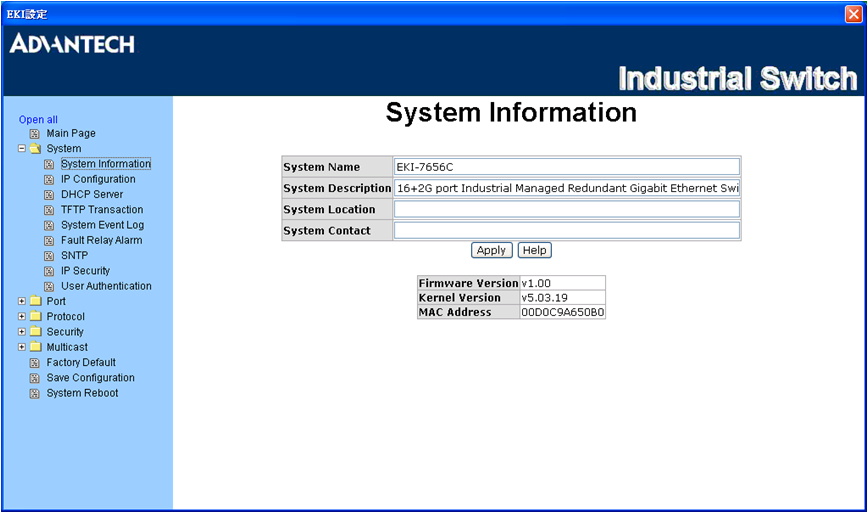
Figure 24.4.3.17: EKI Setting Page
Device Information Setting:Push the button to maintain the device information.
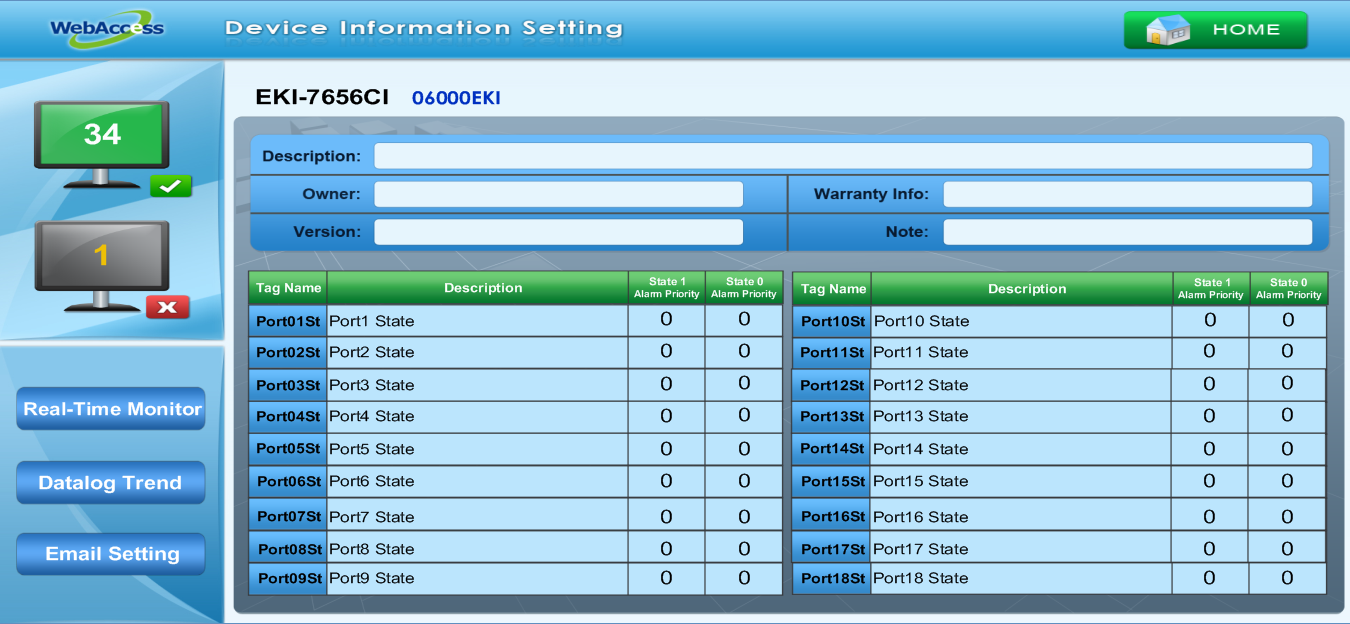
Figure 24.4.3.18: EKI Device Information Setting
SNMP Device display page:Monitor the platform or device that supports SNMP driver. Users can monitor the information from SNMP mib file in WebAccess Express display.
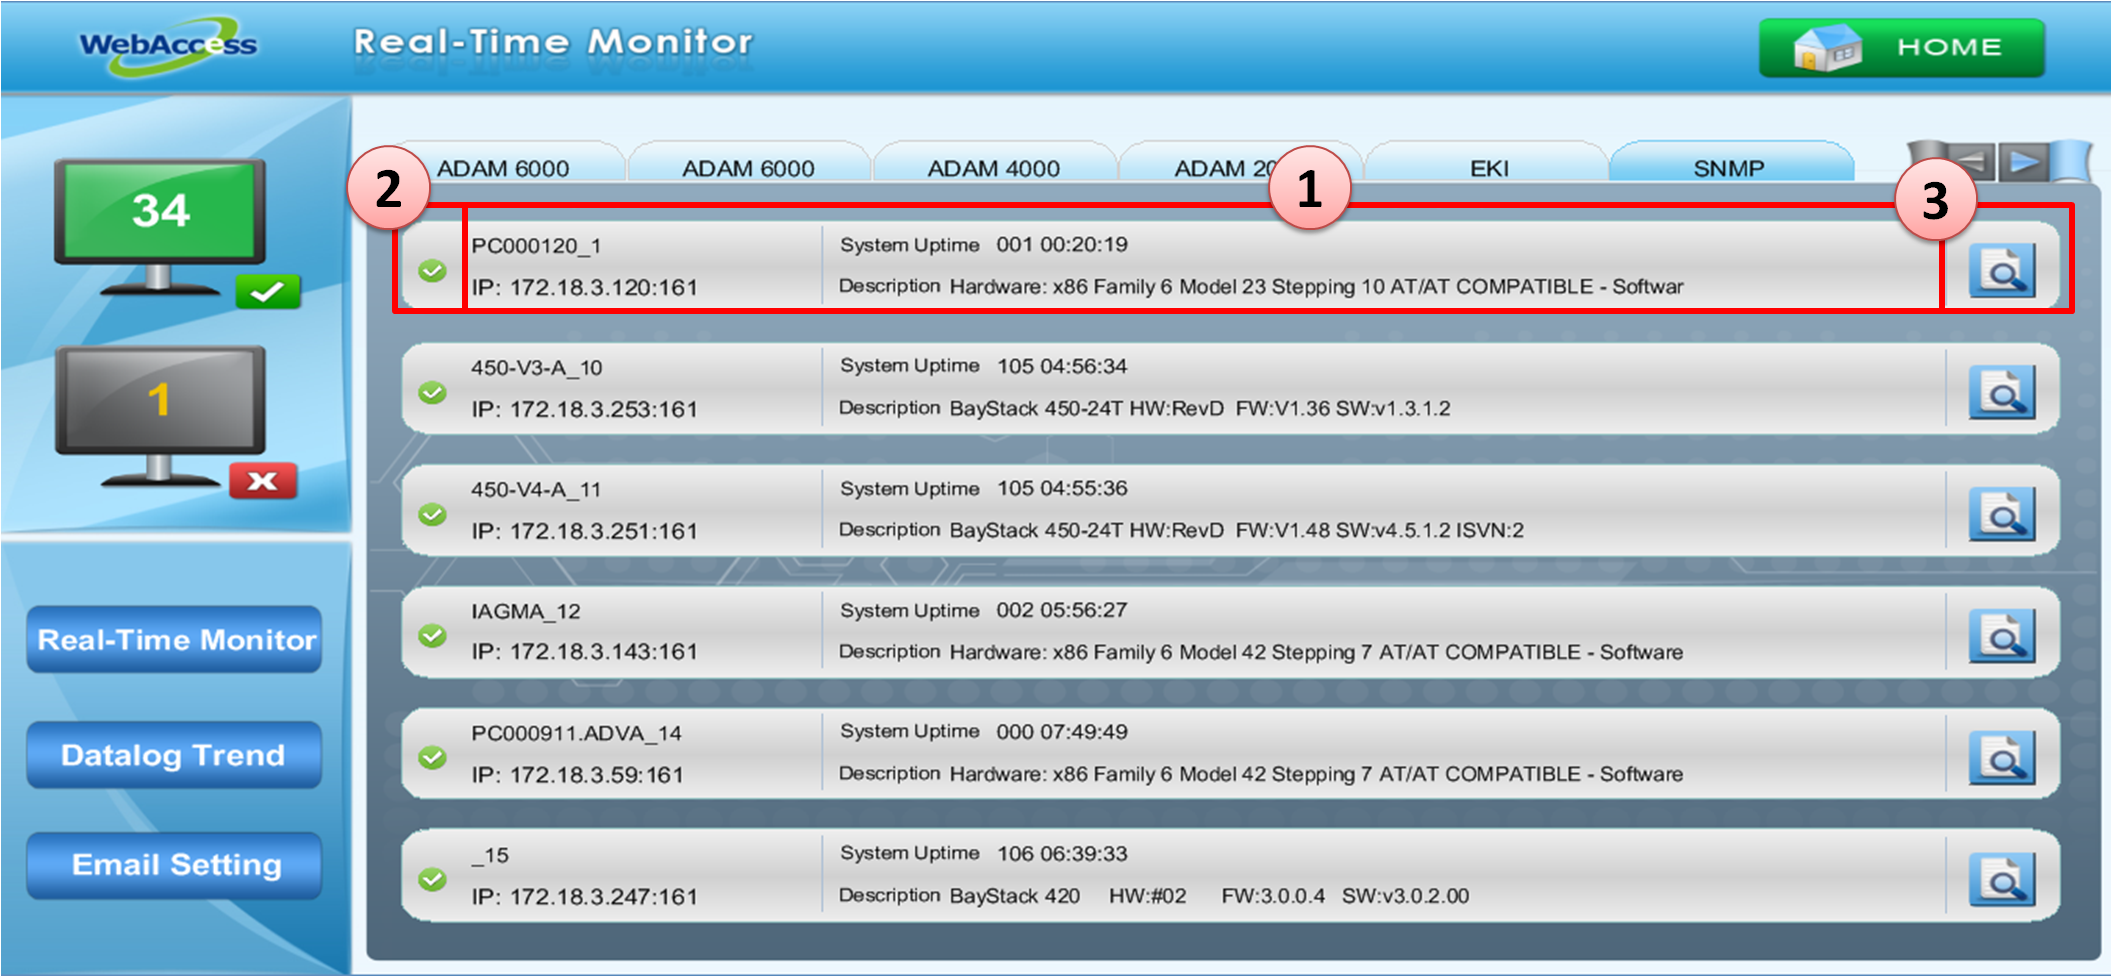
Figure 24.4.3.19: WebAccess Express Display Page –SNMP Device
1. Face plate:Shows the information of devices that support SNMP , including Device name, IP, System Uptime, and Description that have the same details as in the SNMP public mib description column.
2. Device Status:The icon shows the device situation. is online / is offline / is Alarm status. The icon will change to Alarm status as more than one tag is in alarm value.
3. Device Information Setting button:Push the button to maintain the device information.
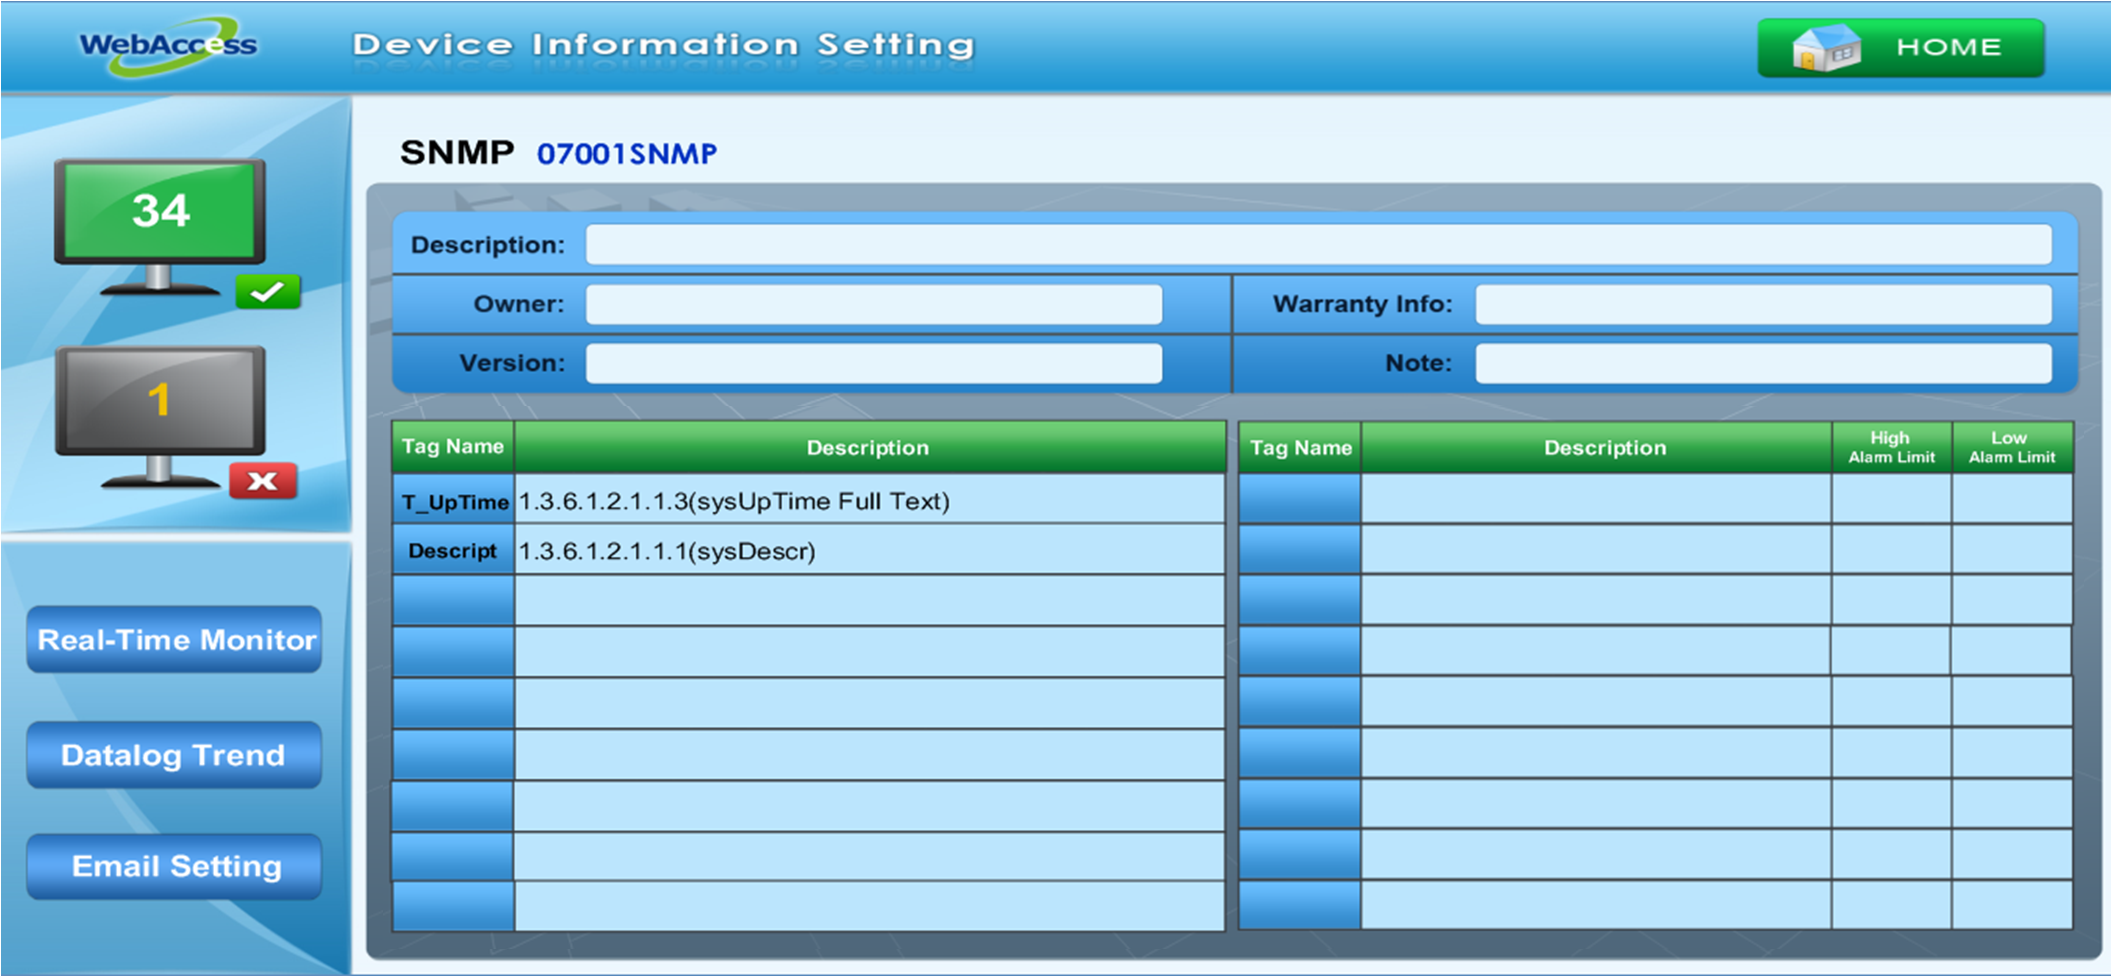
Figure 24.4.3.20: SNMP Device Information Setting
Datalog Trend:Push the Datalog Trend button, users can select the trend of device and go to Trend Analysis page.
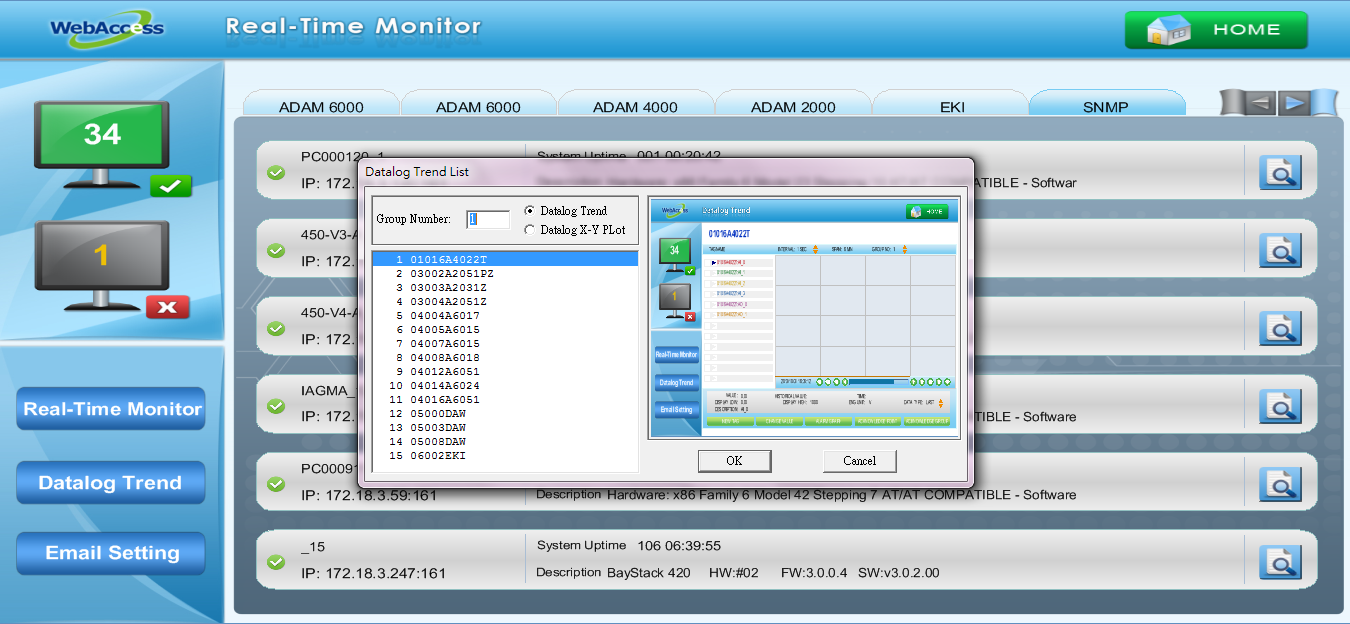
Figure 24.4.3.21: Function button - Datalog Trend
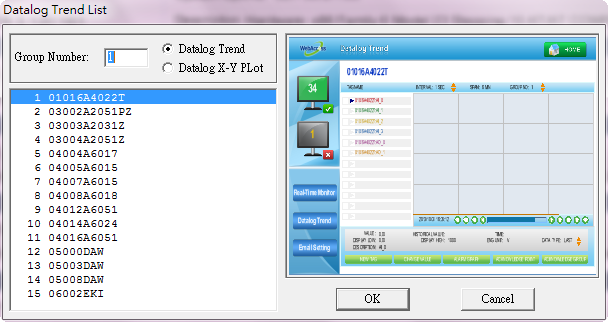
Figure 24.4.3.22: Datalog Trend List
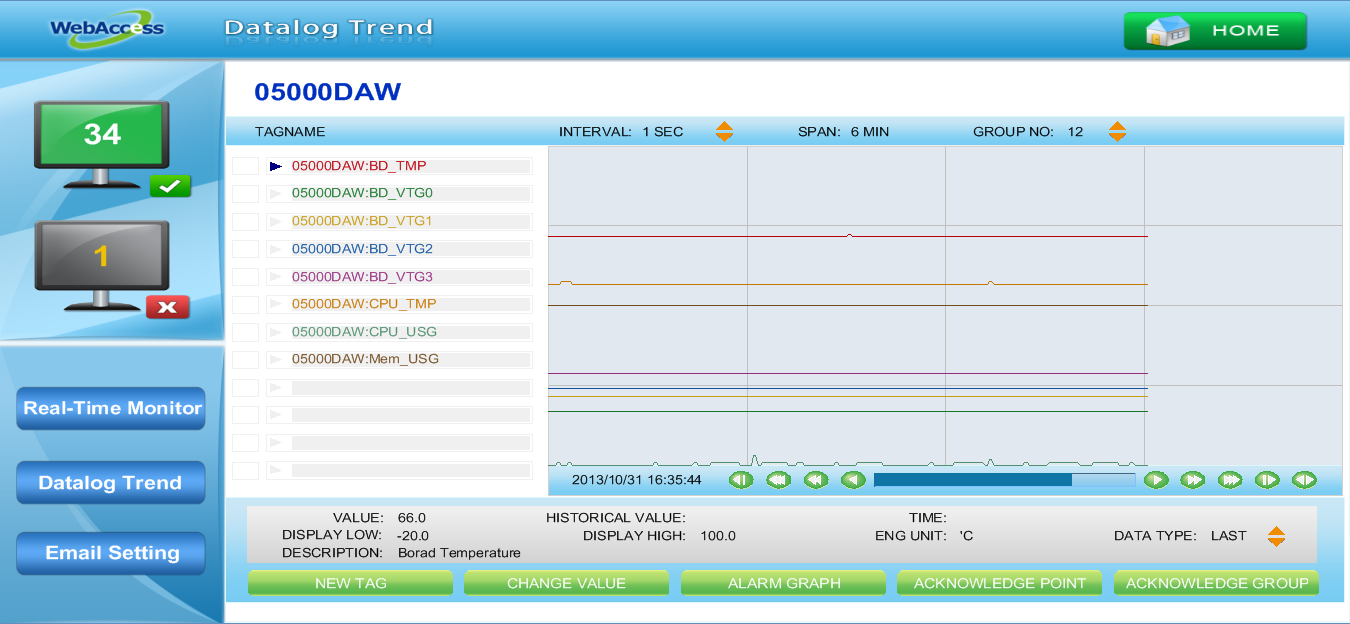
Figure 24.4.3.23: Datalog Trend page
About E-mail setting, please refer 6.2 Data Log Trend
E-mail Setting:Users can set the e-mail information in the project page directly for sending the alarm messages to the manager.
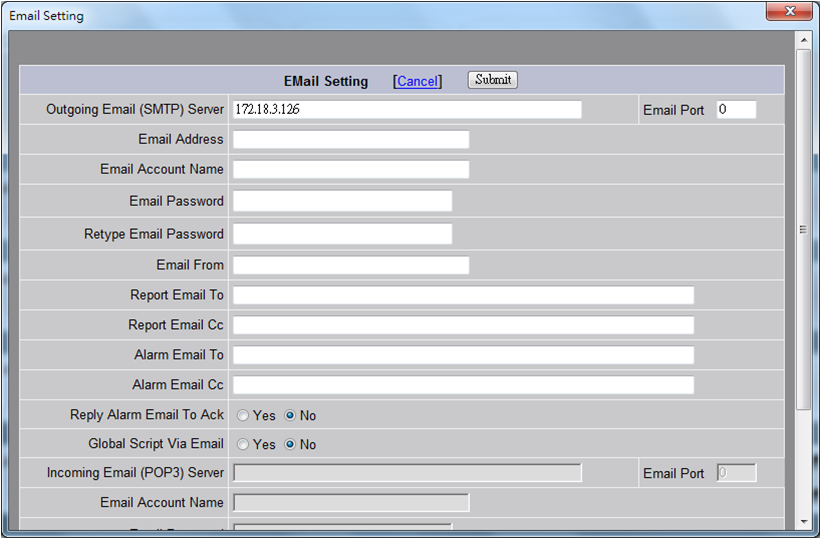
Figure 24.4.3.24: E-mail Setting page
About E-mail setting, please refer 3.2.8 Outgoing Email Server - SMTP